My tiller bolts are shiny silver aluminium. I’ve always been slightly envious of the brightly coloured ones that Win&Win and some other brands sell.
About the paint
I bought a small bottle of Pebeo Porcelaine 150 paint in Lapis Blue about five years. It’s made for painting things like ceramic plates. I used it to paint the Penrose tiling spring gentians on this mug. It’s not super dishwasher safe but it doesn’t look terrible after years of use.
After painting, the instructions say to let it sit for at least 24 hours before baking at 150 C for 35 minutes. That’s fine for ceramics, but the strength of many aluminium alloys is quite sensitive to heat, and having a tiller bolt deform or fail catastrophically could be quite dangerous.
I couldn’t find any reports about using lower temperatures or shorter times to cure the paint, so I made some test pieces and tried:
150C for 30 minutes
120C for 30 minutes
In each case, I pre heated oven before adding the samples. After cooling, both samples had the same resistance to being scratched with a fingernail and felt smooth and glassy. In comparison, a piece that had sat at room temperature for a week was still easy to scratch with a nail and had a slight plasticky feel when rubbed. As 120C was clearly fine for my purpose is having a hard paint layer, I then tried the same temperature for 10 and 5 minutes. The 10 minute sample felt as hard as the 20 minute sample, but the 5 minute one was noticeably easier to scratch. For the shorter times, I used a thermocouple to keep an eye on the temperature and kept opening the oven door to keep the temperature constant as domestic ovens often aren’t terribly precise.
So, instead of 150C for 35 minutes, I knew 120C for 10 minutes was plenty to harden the paint. Would it be ok for the bolts though?
About the alloy
It’s impossible to tell what aluminium alloy something is just by looking or measuring the density. Looking online, some aluminium bolts are made from the 7075 alloy, which is one of the strongest. It’s also one of the most heat sensitive. In order to give the alloy its strength, it’s generally baked at 120C for 24 hours. This combination of temperature and time lets lots of tiny precipitates grow just enough that their size is the optimum for preventing plastic deformation. However, if it’s heated for longer than that, the strength begins to decrease as the precipitates get too big and too far apart, which is called over ageing. If my bolts were made from this alloy, then I could be pretty confident that if I painted then and then baked the paint as directed, they would be somewhat compromised. The chance of this causing failure are pretty small, but I wouldn’t want to risk that. However, using the shorter curing time at 120C would be fine though as an extra 10 minutes is well within the margin of error on a 24 hour heat treatment.
I contacted Fiberbow, who said my bolts were made from 11S aluminium. This is the same as the 2011 alloy, and is normally heat treated at 160 C for 14 hours. As this is considerably hotter than I need to cure the paint, I can be confident that if the bolts ever fail, it won’t be because of a 10 minute treatment at 120C as it’s insufficient to change the microstructure of the alloy, and hence its strength and resistance to fracture.
Painting
Before painting, I marked exactly where each bolt lined up with riser. I washed everything with dish soap and water, then dipped it in isopropyl alcohol and let it dry. I made sure not to touch anything while painting to avoid transferring grease/dirt from my hands.
I attached each bolt to a cordless drill with a wooden pencil so that I could rotate it while holding the brush in place. This gave a better result as it reduced the visibility of brush strokes. I have each bolt two coats. The paint isn’t fully opaque, which gives the colour a nice depth.
Here are the tiller bolts fresh out of the oven.
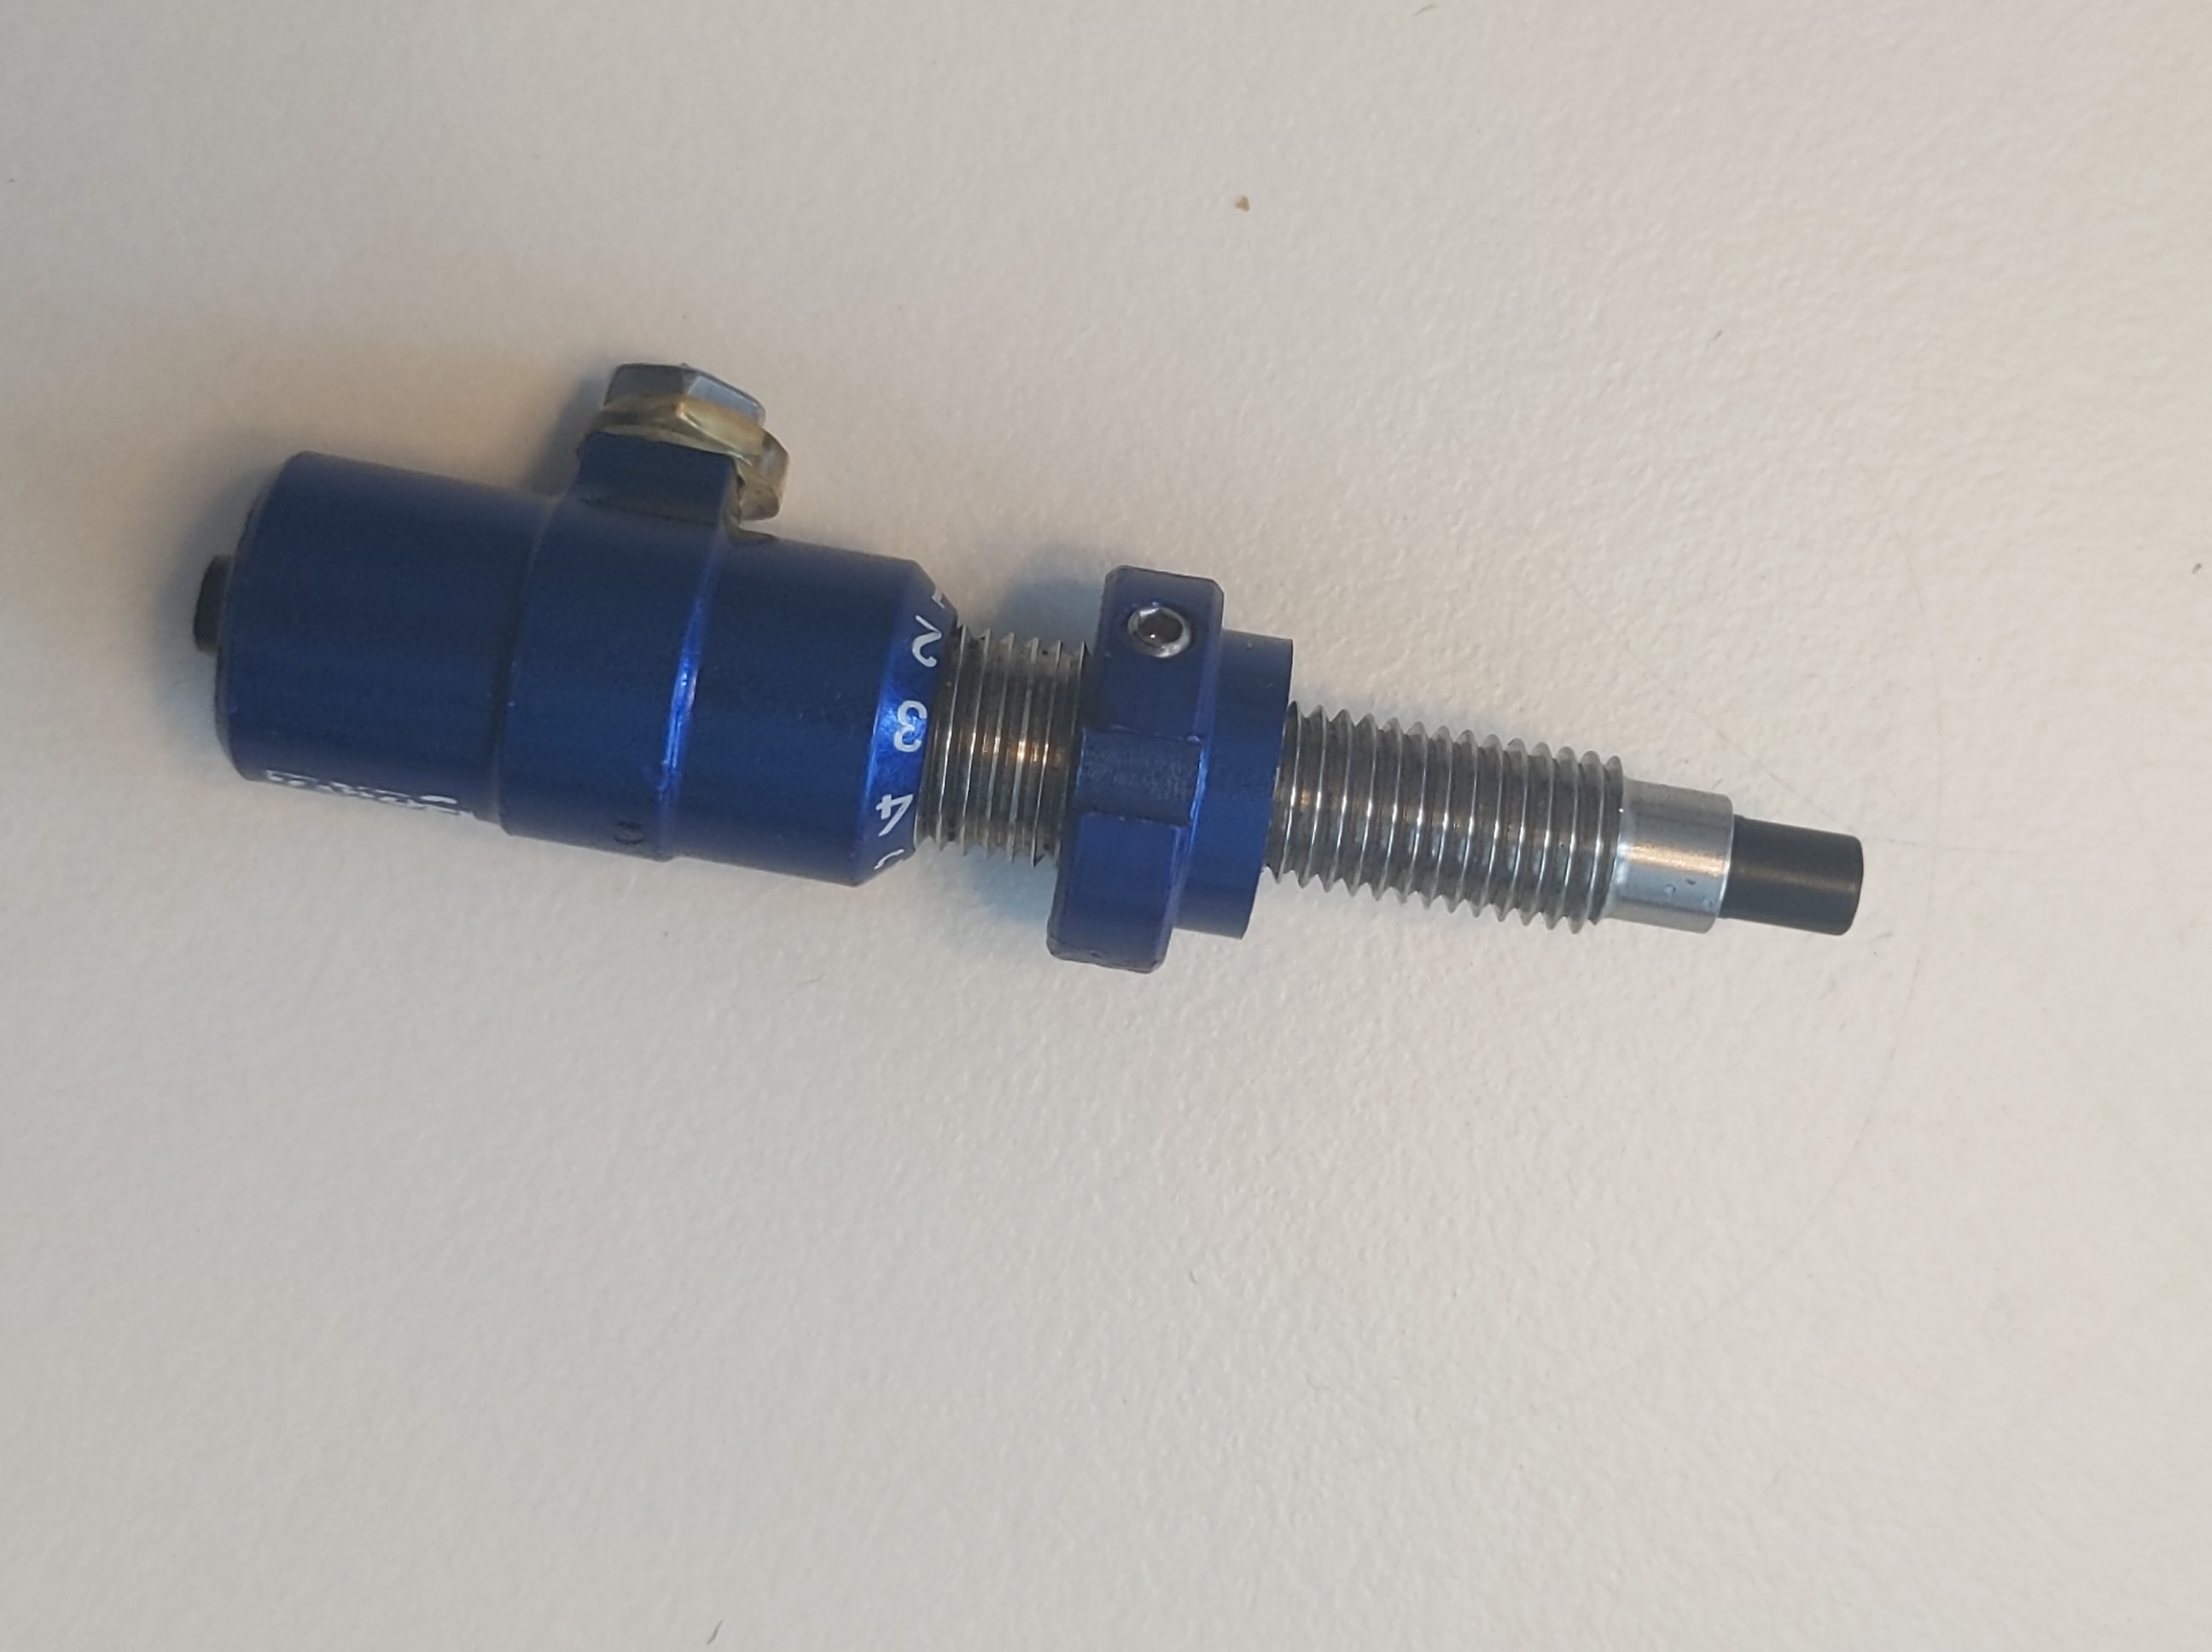
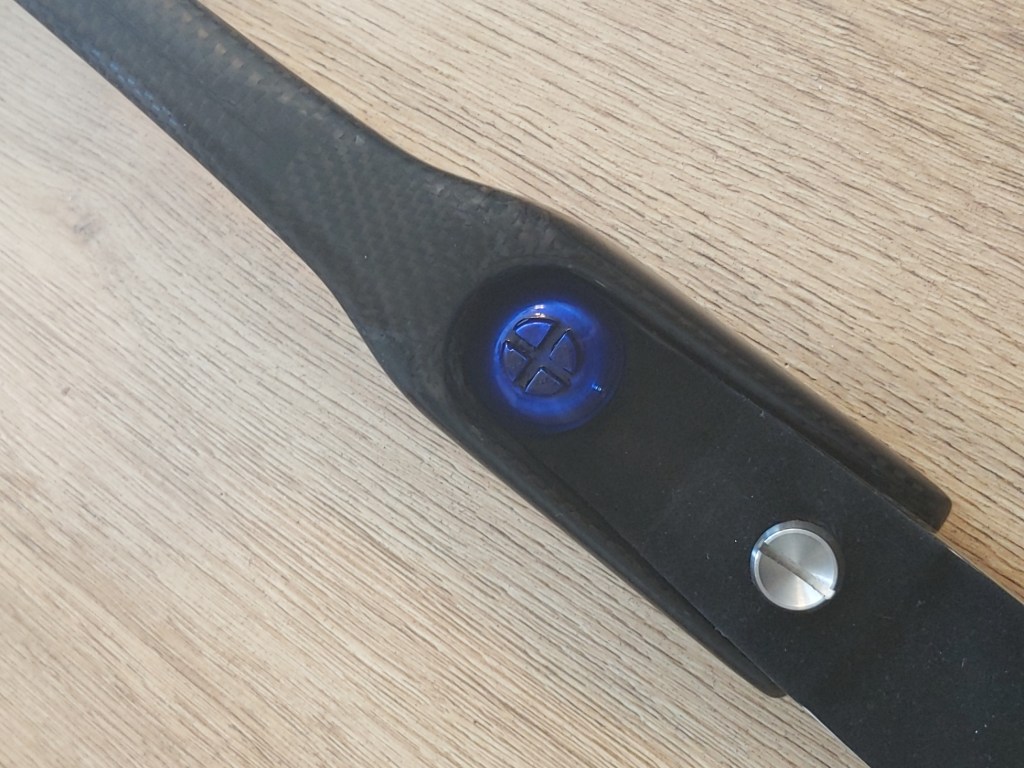
I also did some touch ups on my blue Beiter pressure button, which I’m not terribly careful with. The paint doesn’t hide the scratches completely, but they’re definitely less noticeable from a distance.
Conclusions
Hopefully the hardened paint will last well. I’ll update the post in a few months if it starts to get scratched or come off.
I’m quite satisfied with the look though!
Update: it’s pretty hard wearing and looks the same after two months, though that’s not exactly “long term” yet.
If a match is tied after 5 sets for an individual match or 4 sets for a team match, a one arrow shootoff is held. Each archer shoots one arrow, and the highest score wins. If the scores are the same, then the archer or team with the shot closest to the middle of the target wins. As it only happens when two archers or teams have performed almost identically during the match, I was curious to see whether the results of a one arrow shootoff look like a 50:50 chance or whether the winner could be predicted with some level of accuracy based on which archer or team had a higher score during the qualification round, and whether this was different for international or national competitions.
National Competitions in the UK
I used data available on IANSEO to find all individual one arrow shoot-offs in the the female recurve category. The national competitions used were all legs of the National Tour, the British Target Championships, and the UK Masters. There were 19 shoot-offs in 2019, and 29 in 2018. In 2019, the archer with the higher score in the qualification round won the shoot-off 58% of the time, while in 2018 it was 48% of the time. Had I only picked one year to gather data from, it would have looked quite different! Overall, the archer with the higher qualifying score won 52% of the time, with a 90% confidence interval of 40% to 64%.
Round
percentage won by archer with higher qualification score
number of shoot-offs
number of matches in round
1/32 round
63%
8
32
1/16 round
45%
11
16
1/8 round
64%
11
8
Quarterfinal
60%
10
4
Semifinal
25%
4
2
Final
25%
4
2
Not all competitions had a 1/32 round, or necessarily even a full 16th round. Overall, it looks like shoot-offs were most common in the later matches. However, the overall numbers are too small to say much about the relative frequencies.
Difference between archer ranks and shoot-off outcome
Difference between ranks
percentage win by archer with higher qualification score
number of shoot-offs
Error for 90% confidence interval
1-3
36%
11
25%
4-7
50%
12
24%
8-13
54%
13
23%
16-29
67%
12
24%
The larger the difference in qualification round rank between the two archers, the higher the chance of the higher ranked archer winning was. While it looks strange that for the closest-ranked archers, the lower ranked archer won more frequently, it’s a side-effect of there not being many data points – if the result of one match between the closely-ranked archers had flipped, then the probability would have been 45% instead. We can see this in the confidence interval as well. For the shoot-offs where the difference between the ranks was 8-13, I’m 90% confident that if there were an arbitrarily large number of shoot-offs, the percentage win would be between 31% and 77% – quite a wide range and it includes 50%, which is the result we’d get if the match was decided by a coin flip instead.
Conclusions
So overall it looks like the archer who shot the higher qualifying score is slightly more likely to win a one arrow shoot-off, but that it’s still pretty close to a coin flip on average. When there’s a larger difference between the ranks of the two archers, the probability of the archer with the higher qualifying score winning increases – despite the two achers having shot similarly enough during the match to come to a draw.
International competitions
I used the individual female recurve matches from the 2019 World Archery Championships, and all stages of the World Cup in 2019 and 2018. This gave 98 one arrow shoot-offs, of which 47% were won by the archer with the higher qualification score. In 2019, it was 51% and in 2018 it was 41%.
Overall, using a 90% confidence interval for a sample size of 98, the 47% can better be expressed as 38% – 55%. So I’m 90% certain that the true value would fall in that range. I’m 68% sure that the true value is in the range between 42% to 52%. So I really can’t rule out the idea that a shoot-off is equivalent to a coin flip in terms of the result.
For the international competitions, a shoot-off was more likely to happen later on in the competition. This is the same as in the national competitions.
Difference between ranks
% win by higher qualification score
# shoot-offs
Error for 90% confidence interval
1-10
38%
26
16%
11-25
56%
30
15%
26-50
47%
34
14%
51-93
38%
8
29%
For each group of ranks, a 50% probability is within the range that I am 90% confident is the “true” probability of winning the shoot-off. In other words, I’m not able to confidently say that the 38% probability in the first row is actually different to a coin flip.
Conclusions
So, overall the result of a one arrow shoot-off is not distinguishable from a coin flip, whether we look at national or international competitions. Further, there isn’t a clear relationship between the difference in rank of the archers, or how late in the competition the shoot-off happens.
I was expecting that there might be a meaningful difference for one of those cases. After all, if two archers with very different ranks are having a shoot-off, maybe the lower ranked (higher scoring) archer is having a bad day if the match is that close, or she feels more pressure as she’s “supposed” to win the match and has more to lose, or some other factor.
However, it doesn’t seem to be the case, at least with this amount of data. This analysis was only looking at individual female recurve matches – it’s entirely possible that there’s a different result for male archers, or teams, or other bowstyles.
Korea Archery recently published videos of “Special Matches” between national team members at the country’s national training center. The videos had an unusual feature that I haven’t seen before: the competitors’ heart rates.
The feature only appeared a few times per match, and usually only covered a few seconds so often one archer was shooting while the other archer was just standing still between shots.
The heart rate values themselves jumped around significantly and the software had some difficulties in recognising moving faces. So there’s a fair amount of scatter and it’s not clear whether the numbers captured at that point are representative of each athlete’s heart rate over the rest of the match, or whether the heart rate overlay was taken at the same time during each match.
Previous uses
The technology used is fairly new and is mostly the topic of research papers, not a mature technology. There are two methods I’ve read about to get heart rate from videos: looking at the subtle change in skin colour with the oxygenation of the blood, or looking at small movements to the head caused by the heartbeat. There’s an interesting review of the techniques used here.
Heart rate and elite archery
I remember my archery coach telling me many years ago that scientists had found that Olympic archer’s best shots happened when they released the string between heartbeats, and therefore a low heart rate was important to decrease the chance of the release happening during the heartbeat. This made intuitive sense to my teenage self since the heart beat can be felt with a finger, which means motion, which would add variability to an archer’s release or the direction they’re pointing the bow.
I found the study in 1989 that must be the one my coach heard about, and read through it. The study participants were four elite Australian archers: one compound archer, one 17 year old male recurve archer, one 21 year old female recurve archer, and one 51 year old female recurve archer – quite the sample size! Hopefully they and their hearts are representative of elite archers in general. Each archer shot a series of arrows on several different days while their heart, balance, and timing were monitored by the researchers. The metric used to classify arrows is in the table below.
Most of the arrows shot were considered “good”. The average heart rate of the three recurve archers during the “good” arrows was 90 BPM just before the release, while it was 96 BPM at the same point in the cycle during the “average” and “bad” shots. The difference isn’t large but it was consistent between the three archers. The resting heart rates were 6-25 BPM lower than the values when they were shooting.
Does this mean that the archers were more accurate when their heart rate was lower? Not necessarily, because the measure of a “good” arrow was subjective. If a shot hit the middle but either the archer or coach didn’t think the shot felt or looked quite right, it was considered “average” instead.
The study also looked at where in the cardiac cycle good, average, and bad arrows were released. The cardiac cycle is divided into several regions seen on an ECG. I was unfamiliar with the terminology, but found this site useful. In this paper, the regions used were PQ, QRS, ST, T, and the mid-region. The lengths of the different regions aren’t the same, and vary between people and with heart rate, so it’s not expected that a similar number of shots would happen during each part of the cycle in a random scenario. The study didn’t indicate the length of each part of the cycle for these archers. In practice, the PQ interfal lasts about 120-200 ms, the QRS part 80-120 ms, the Q-T interval 350-430 ms, and the mid-region time takes up most of the remainder. When the heart rate increases, the Q-T interval decreases a little, but most of the decrease in cycle time happens during the rest of the cycle, according to here and here. If a heart beating sounds like “ba-dum, ba-dum, ba-dum”, then the QRS part is the “ba” and the T region is the “dum”, so the ST portion is in between the “ba” and “dum” and the mid-region and PQ region together make up the time from the end of one beat to the beginning of the next.
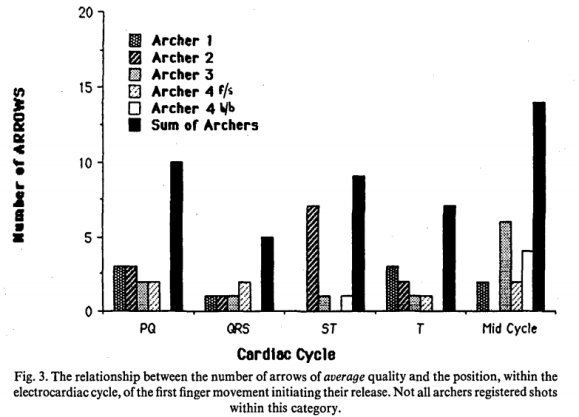
Distribution of shots within the cardiac cycle for good, average, and bad shots. Note the y axes are different.
Looking at how many “good”, “average”, and “bad” shots happened during each phase of the cycle, it’s clear that the distribution is different between the good shots and the average or bad shots. It looks like good shots happened disproportionately more during the ST and mid-cycle portions – much more so than could be reasonably explained by those sections being maybe up to 40 ms longer during the good shots.
Comparing the ratio of good to average or bad shots within one part of the cardiac cycle is a more quantitative method as it doesn’t depend on knowing the relative duration of each part of the cycle. As the heart rate only changed by about 6 BPM (35 ms) between the two types of shot, the duration of each part of the cardiac cycle shouldn’t have changed significantly.
PQ
QRS
ST
T
mid-region
ratio of good:other shots
1.2
0.7
3.8
0
2.8
Ratio of good shots to average or bad shots during each stage of the cardiac cycle.
Based on these ratios, it looks like arrows released during the ST phase and mid-region were much more likely to be good shots. Does this mean that archers were more accurate then? Not necessarily, since shots released during the other phases that were just as accurate but didn’t feel “good” to the archer would have been classified as “average”. It may be that shots released during the QRS and T region, when the beat of the heart is felt, feel worse but are not less accurate.
Regardless of how long each part of the cardiac cycle was for each archer, there is a clear difference in the fraction of arrows shot during each part of the cycle. The archers would have been using a clicker to provide an audible indication of when the arrow was drawn back to a set distance. The time between the sound of the clicker is similar to the auditory reflex time. This time was not measured in the study, but it would have been interesting to know whether the time between the click and the release was more variable during the good shots in order to line up better with the ST or mid-region of the cardiac cycle, or whether it did not vary more than usual. The latter would indicate some synchronisation between the archer’s cycle of drawing the bow, aiming, and releasing, and their heart rate.
Heart rate variation and accuracy for elite archers
A 2020 article here followed a similar methodology. 4 compound and 3 recurve elite male Indian archers were filmed shooting while wearing a heart rate monitor. The study found that for all archers, the average heart rate decreased during the 5 seconds before the arrow was released, and continued to decrease until 3 seconds after the shot, after which it rose again. The mean heart rate when archers shot an 8 was about 8 BPM higher than when they shot a 9 or 10, which was statistically significant. While the mean heart rate was 1 BPM higher for shots that scored a 9 instead of a 10, this difference was not statistically significant.
In contrast, a 2015 article here showed the opposite relationship between heart rate and score in 3 female and 1 male recurve archer. The heart rate was about 10 BPM higher during shots that scored a 10 than those that scored 8.
Heart rate monitoring and accuracy
Another paper looked at the both effect on accuracy of both the time in the cardiac cycle when the arrow released, and of hearing the archer’s heart beat. 36 people aged 16-24 participated. I couldn’t tell whether the archers were elite, experienced, or novices due to the paper being in Japanese and using Google Translate. The shooting distance was 50 m, but the target face wasn’t specified. The average arrow value was 7, which would be too low for elite archers on a 80 cm target face, but also too high for beginner archers on a 122 cm face. Each archer shot 6 arrows under normal conditions, and 6 with a earpiece playing back the sound of their heart.
Without the heartrate feedback, 53% of shots were released during ventricular systole (the “ba-dum” sound), while this was only 36% when wearing the earpiece. The scores are in the table below:
no earpiece
with heartrate played back
score
std. dev
shots
score
std. dev.
shots
systole
6.8
2.3
114
6.9
2.3
77
diastole
7.3
1.9
102
7.6
1.8
139
Average arrow value, standard deviation, and number of shots for arrows shot with and without the heartrate playback during ventricular systole and ventricular diastole.
The difference in average score for shots during each part of the cardiac cycle did not show a stastitically significant difference when the heartrate playback was added. However, the fraction of shots that were released during diastole increased and therefore so did the average score of the archers when they could hear their pulse. The heart rates did not change significantly when the earpiece was added, so the relative duration of systole and diastole should not have changed either.
It would be interesting to know whether this effect would persist if more than 6 arrows per archer were shot, and whether archers who were accustomed to that feedback shot better or worse in competitions where electronic devices aren’t allowed.
Heart rate for experienced and inexperienced archers
This study from 2011 compared the heart rate and score of experienced and inexperienced archers. The experienced archers shot higher scores and had lower heart rates. The heart rate was only measured during shooting, so there’s no way of knowing whether the resting heart rates of both groups were the same and the inexperienced archers had a larger increase in heart rate during shooting, or whether the experienced archers already had a lower heart rate due to long term physical activity and both groups had the same increase in rate when shooting. The study concludes experience in archery results in both better accuracy and lower heart rate, but that is not necessarily supported by their data. Had the researchers also told the subjects to, for example, run for several minutes before shooting so as to elevate their heart rate, then they would have been able to see whether experience alone was enough to give their result, or if heart rate also played a role.
Results
I was curious as to whether the heart rate overlay was just a silly novelty or if it had any relation to the match. All these archers are world class and would be expected therefore to have good control of their nerves during matches. As there were 7 matches between the female archers and 8 between the male archers, I tabulated what looked like a representative heart rate for each archer based on the values on the screen. For videos where there were multiple instances of the heart rate replay I used the first one, which was after the first or second end. After writing down the heart rates, I checked who won the match.
Target 1
Target 2
Target 1 HR
Target 2 HR
Winner
Winner lower heart rate?
Yoo Su Jung
Chang Hye Jin
82
66
2 (SO)
yes
An San
Chang Hye Jin
62
69
1
yes
Yoo Su Jung
Lim Si Hyun
75
80
1 (SO)
yes
Yoo Su Jung
Kang Chae Young
72
54
2
yes
Lee Ga Young
Chang Hye Jin
72
63
2
yes
An San
Kang Chae Young
56
60
1
yes
Jeon Ina
Kang Chae Young
90
65
2
yes
The women’s matches. SO = one arrow shoot-off.
Target 1
Target 2
Target 1 HR
Target 2 HR
Winner
Winner lower heart rate?
Kim Woo Jin
Lee Woo Seok
65
54
1
no
Bae Jae Hyun
Kim Je Deok
95
70
2 (SO)
yes
Kim Woo Jin
Bae Jae Hyun
66
62
1
no
Lee Woo Seok
Kim Je Deok
75
85
1
yes
Oh Jin Hyek
Lee Woo Seok
92
81
2(SO)
yes
Kim Woo Jin
Lee Seung Yoon
66
55
1
no
Bae Jae Hyun
Han Woo Tak
77
86
1
yes
Kim Jong Ho
Kim Je Deok
84
64
2
yes
The men’s matches. SO = one arrow shoot-off
Analysis
Heart rate difference between groups
Firstly, the heart rates are all over the place, going from 54 to 95 BPM. While this is a wide range, it’s still within the range of resting heart rates seen for the general population. The athletes aren’t at rest, but athletes tend to have lower resting heart rates for the general population, and doing a standing strength-related high stakes activity is expected to raise the heart rate, so maybe the two factors mostly cancel out.
The average rate from all the women’s matches was 68.8 BPM while that for the men’s matches was 73.6 BPM. For the same level of fitness, women tend to have a slightly higher heart rate than men by about 4 BPM so this is a bit of a surprise. A wide range of factors affect the resting heart rate though:
exercise (lower in people who do more)
body mass index (higher if higher)
amount of sleep (too little or too much sleep give a higher rate)
alcohol consumption the day before
age
time in the menstrual cycle
some medications
stress
genetics
The heart rate during the match is some combination of the resting heart rate + whatever increase the athlete gets from standing up, using their bow, feeling the pressure.
So it could be that the female team, whose members are slimmer on average than the male team, always has a lower heart rate. Or maybe the male team normally has a lower heart rate, but they all had a late night and a few drinks the day before the matches – who knows.
Heart rate correlation with match result
In 12 out of 15 matches (80%), the winner was the athlete who had the lower heart rate at the time it was measured. If there was no correlation whatsoever, then we’d expect the athlete with the lower heart rate to win 50% of the matches, but there would still be about a 1.8% chance of the athlete with the lower heart rate winning at least 80% of the matches just by random chance – so quite unlikely but still possible.
However, it gets more interesting if we look at the 3 matches that were won by the athlete with the higher heart rate: they were all won by Kim Woo Jin. So 100% of the matches that didn’t include him had the athlete with the higher heart rate win – a probability of 0.02%.
While the correlation between heart rate and match result for archers who aren’t Kim Woo Jin is pretty clear, it says nothing about causation. If one causes the other, it could be either way around:
The archer who has a bad start to the match (not necessarily a low first end score, but if they don’t feel quite right about their form in the first end) becomes more nervous and this causes their heart rate to go up.
The archer with the lower heart rate is probably feeling calmer and is more likely to shoot their best.
This could also be cyclical, where perception of not doing well during the match increases the heart rate which reduces shot quality which increases the perception of not doing well etc.
I was quite surprised by this result because heart rate is varies a lot between people: one archer’s resting heart rate might be higher than another one’s “feeling anxious while shooting” heart rate. While I would expect an archer to shoot better when their heart rate is closer to their resting value as it probably means they’re calmer and better able to control fine movements, it seems odd that heart rate during the match, as opposed to the increase in heart rate relative to the archer’s resting heart rate value, was so closely associated with winning.
Later ends
I hadn’t noticed the first time I looked at the matches that most videos show several “BPM rewind”. I admit I was jumping forward during the videos to see if there were any interesting slow motion replays and the first match I looked at only had one heart rate clip. So to check how repeatable the previous correlation was, I looked at the other ends in the women’s matches that had heart rate data. Most of the ends that didn’t have heart rate data had a high speed video of one of the archers filmed at a frame rate between 200 and 300 fps.
Women finals
Gold final: after ends 1, 2, 4: An lower than Chang in all three videos.
Bronze final: after ends 2, 3: Yoo higher than Kang in both videos.
Women semi-finals
Yoo vs Chang after 2, 3, 5: Yoo still about 15 BPM higher than Chang in 3rd end, but in the 5th end Chang instead was 15 BPM higher than Yoo.
An vs Kang after 1, 3: An lower than Kang in both ends
Women quarter-finals
Jeon vs Kang after end 2 only.
Yoo vs Lim after end 1, 3: in the third end the reading cut out and both archers varied a lot over the same range.
Lee vs Chang after ends 1, 3: the overlay in the third end has values that fluctuate by 15 BPM for both archers over a duration of a few seconds, which sounds like the program was struggling to read their faces.
So it looks like the heart rate difference between the two archers doesn’t generally change during the match either.
Conclusions
Neither the study of Australian archers, nor the videos of Korean archers are enough to say if there is a causative link between lower heart rate and better shots. There are many questions raised that would be interesting to know more about at a later date:
Do elite archers shoot less accurately when their heart rate is elevated due to an external factor (like recent exercise)?
Is it the heart rate during shooting, or the difference between the resting heart rate and the heart rate during shooting that is relevant here?
Are elite archers more accurate when the arrow is released during the ST region and mid-region of the cardiac cycle? Is the same true for experienced and inexperienced archers?
Is there any causation between increased heart rate and bad shots? If so, which way around is it?
Having the correct nocking point height is crucial to having an arrow that flies in a way that its pointing in the direction that it’s moving. If the nocking point is considerably high or low, the arrow will look a bit like this when it comes out of the bow if viewed from the side:
If the nock point is at the low end (near 0 mm), then the back of the arrow will be fairly close to the shelf of the bow and the fletches may hit it in passing. If this happens in the same way every time, then that can be perfectly consistent even if it does cause some wear to the fletch thats being repeatedly deformed. If it only occasionally hits (when the archer flubs their release) then the arrow would be expected to be deflected somewhat.
If the nock point is at the high end, it’s less clear what’s it’s likely to look like. During the time when the arrow is in contact with the arrow rest, which is only the first few milliseconds of movement, the arrow angle will be changing significantly as the nock end gets closer to the bow. This could press the arrow shaft into the arrow rest, making it more likely to break over time.
I decided to take a series of videos to see how changing the nocking point affected the amount the shaft moved up and down while it was still in contact with the string, and how much the fletches touched the bow. I was also interested to see what the flight looked like when at my “ideal” nocking point height, and whether the flight was similar for a wide range araound this point or if changed rapidly on either side of that region.
In my case, “ideal” means about 9 mm above the zero line, and was determined by shooting fletched and bare arrows until they both hit the target at the same height and angle at 8-30 m. This is a pretty standard procedure. The idea is that when the path that the tail of the arrow follows is above or below the path that the point follows, the tail experiences more drag. If the tail has fletches on it, then it will rotate so that the tail is following the point after a few meters. If the tail has no fletches, it will experience less drag and will rotate much more gradually. So if the two arrows land in the same place, that means that the arrows were flying with the tail following the point.
The “ideal” nocking point is quite dependent on the archer – if the pressure on the string from fingers below the string changes relative to the pressure from the finger (if any) above the string, this changes how the arrow moves up and down between when the arrow is released and when it leaves the string. Likewise, changing the height of the grip and the position of the pressure point on the grip affects the relative pull of the top and bottom limbs on the arrow and changes the arrow flight. So there is nothing special about my current preferred nocking point height other than it works for me.
The test can be done at longer distsances and indeed the result is more sensitive, but the slightly increased drag on the fletches compared to a bare shaft means the former will drop more, which will give a higher “correct” nocking point height than at shorter distances. At 70 m, the nocking point height that gives bare and fletched arrows in the same group is several mm higher than the one at 20-30 m.
Definitions
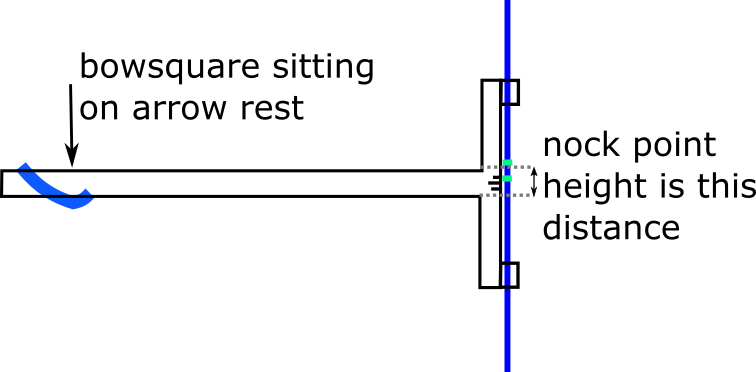
Firstly, the nocking point height can be defined in several ways depending on whether someone has one or two nocking points, and whether they mean the top or bottom of the top or bottom nocking point, or the middle of the arrow nock. The most common definition though is the bottom of the top (or only) nocking point as the nock of the arrow naturally rests against this point when nocked. That is the definition I’m using.
Many bowsquares have a “0” line which is halfway between the top and bottom of the bowsquare. This is so that it works equally well left and right handed; it’s not an actual 0 line.
When the nocking point height is set to 0, the arrow point is pointing slightly up because the arrow nock does not have zero thickness. To have the arrow at excatly 90o to the string, half the height of the arrow nock would need to be added.
Method
I used my regular bow setup. It gives the loose nock fit recommended by the Easton tuning guide: if I give the string a good flick a few inches away from the nocking point, the arrow drops off the bow. I changed the nocking point height by rotating a homemade nock and measuring the height with my bowsquare, which has an increment of 1mm. The uncertainty in each value was a bit less than half a mm.
The camera, a Sony RX100 mkIV was set to the highest frame rate of 1000 fps. To minimise arrow motion blur, the shutter was at the maximum setting of 1/12800. As the arrow has a speed of about 63 m/s after leaving the string, it travels 4.9 mm during each frame so there is still a noticeably amount of motion blur. As such high shutter speeds require a significant amount of light, a 500 W halogen light was pointed at the bow window from about 20 cm away. The vanes used were mylar Spin-Wing vanes which extend 7 mm away from the arrow and are 45 mm long.
The clicker was used for each arrow, though as the reaction time of 15 ms between the clicker falling and the arrow beginning to move would double the video length, each clip was cut to begin as the arrow started to move.
Result
The playback speed can be reduced by clicking on the gear symbol, and you can move frame by frame with the “,” and “.” keys.
As the camera was at the same height as the arrow, only vertical movements of the shaft are visible. The bending of the arrow in the horizontal plane is not seen. These arrows are matched to the bow and archer, and there is considerable clearance between the arrow rest and button and the back end of the arrow as it passes the bow.
The movement of the clicker after the arrow has left the bow was a surprise. However, the clicker is a fairly flexible piece of spring steel and a considerable amount of vibration (about 13 J) is dissipated in the bow after the arrow leaves.
At low heights
The lowest nocking point height that gave clearance for the spin-wing vanes was either 6 or 7 mm. Due to the motion blur it’s a bit ambiguous which it is. If I’d been using 4″ plastifletch vanes which are 13 mm tall instead, then the minimum for clearance would have been around 10 mm if a vane was pointing straight down. If the vane was 30o away from horizontal as is common when three fletches are used, the minimum would be halved.
I also did a few shots while either pushing the bow with the heel of my hand, which moved the tail of the arrow 2 mm lower as it was passing the button, and the webbing between my thumb and index finger, which moved the arrow 2 mm higher. These represent the extremes of pressure point. In practice, I would expect my natural inconsistency in bow hand pressure to contribute about 1 mm of variability to the arrow clearance.
With only one shot per setting, it’s impossible to be definitive, but the clearance between the shaft and the arrow shelf increases somewhat linearly from 4 mm at a nock height of 0 to 14.5 mm at a nock height of 16. The available data isn’t enough to tell whether there would still be a plateau from 9 – 14 mm if I redid those settings several times.
Is clearance necessary? It doesn’t seem to be the case with feathers, which are are often thick enough that they always hit the bow somewhat. Vanes that don’t clear the bow tend to leave a build-up of plastic on the bow, which itself isn’t much of an issue but does increase arrow maintenance. Spin-wings are quite fragile and crease easily so any contact is undesireable. However, a feather (or vane) that always brushes past the riser with a similar amount of contact is consistent. A somewhat stiff vane that sometimes clears the riser and sometimes doesn’t is a way to introduce error since some small arrow deflection caused by the vane contact is likely.
At higher heights
As the nocking point height is increased above 9 mm, the amount the shaft moves up and down in flight increases. This is best seen by comparing the height of the shaft as it passes the clicker
Best height
From the videos alone, I don’t have any data that would indicate a particular ideal value. While values too low for vane clearance would be undesireable, the increased wobble at higher values doesn’t have a clear downside that I’m aware of.
The height that gave the straightest flight in terms of total vertical motion of the shaft was at 9 mm +- 1 mm. This is also the height that gives the straightest flight according to the bareshaft test. It’s refreshing that there is at least a correlation between the two.
However, I can’t say that 9 mm gives me any better accuracy than any other value. It’s possible that it does, but I haven’t done any testing that would give me an idea of it. I’ve used a range of nocking point heights from 6 – 12 mm at different times, either for a non-performance based reason like having the same sight mark for bareshafts and fletched arrows at 70 m, or by accident.
While minimising the angle between the arrow shaft and the direction of flight does reduce drag, I don’t know if it’s by a significant enough amount to care. Besides, the arrow with the least drag is not necessarily the best grouping arrow. However, I don’t have any evidence and I haven’t seen any systematic tests of nocking point height and group size yet, though there are enough anecdotes that it’s worth testing, and the anecdotes indicate a large enough difference in group size that it should be possible to run the test without needing hundreds of arrows per nocking point height.
This is a topic that I’ve come across several times in different forums. There is the concept that when an olympic-style bow/arrow/archer system is tuned, the arrow speed will be higher than if it is out of tune. In other words, that there’s something about a tuned system that optimises energy transfer to the arrow. I’ve seen this repeated many times, generally along the lines of: when the bow is tuned, the arrow will be faster and therefore there will be less vibrational energy left in the bow. The only instance I’ve found that implies that this idea is based on actual evidence is from Vittorio on ArcheryTalk in 2006, who said that he’d previously measured this with a chronograph. In a post on the long-defunct Sagittarius blackboard in 2003, he said “The efficiency of the bow increases with tuning. This may generate up to 2fps more (recurve) from a well tuned to a poorly tuned bow. This s another factor, and a poorly tuned bow or a critycal one (too close to the limit) ill surely be morenoisy than perfely tuned machines.” Unfortunately there wasn’t any other information about the test (or any of the results).
A 2 fps (0.6 m/s) difference in speed is within the capabilities of my chronograph. I thought it would be interesting to make a test that looked at the effect of arrow spine without other variables that affect arrow speed.
What does “tuned” look like?
The definition of “tuned” used in these cases is based on a bareshaft landing either in the same place as the fletched arrows (most commonly), or slightly to the stiff side of them, by some small amount chosen by the archer based on what combination of bow settings feels optimal after iterating through all the variables available to them. In the latter case then this is slightly arbitrary as any position could be called “tuned” if the archer says so and there doesn’t appear to have been a consensus about how much the two should deviate. Only “slightly arbitrary” because the bareshaft is still somewhere nearby on the target, and which means there’s still only a fairly narrow range of possible conditions.
How would the arrow “know” which condition is considered to be in tune by the archer, and how could this be distinguished from a speed increase with a different cause? Perhaps there more to it when the definition of tuned means that the bareshaft lands with the fletched arrow, as this implies that the arrows are moving in the direction that they are pointing as they leave the bow since under this condition the addition of extra drag at the back of the arrow (fletches) doesn’t change its direction.
Calculating arrow speed
The factors that are likely to be changed when tuning a bow and which have a significant effect on arrow speed, are the draw weight, arrow mass (by changing points or nocks or arrow size), and brace height. The effect of each of these on the expected arrow speed can be calculated pretty accurately with the equation below. After a great many chronograph tests with different draw weights, brace heights, and arrows, I haven’t yet noticed any significant discrepancies between the speeds calculated by the equation and the ones I’ve measured.
where: is the arrow speed, is the draw weight, is the distance the arrow moves when being drawn back, so = arrow length – brace height – length of arrow in front of the pressure button at full draw,
is a unitless number that indicates how much extra energy is stored during the draw relative to a bow where the increase in draw force varies linearly across the whole range. It is constant for a given draw force curve – which means that if the draw weight is adjusted by changing the angle of the limbs, the constant will change also. It’s a number between 1 and maybe 1.5 for a recurve bow (1.16 for my bow with Samick Extreme limbs which have a “conventional” geometry and are made from carbon fibre+foam). If the integral of the draw weight over the draw length was used instead of just force x displacement, then the constant wouldn’t be needed.
mass is for the whole arrow, is the virtual mass. There’s more detail about it here, but for now it’s just a constant to account for the fact that while the arrow is accelerated to v, different parts of the string and limbs are accelerated to other lower speeds, from the part of the string next to the nock being accelerated the same amount as the arrow, all the way to the base of the limbs barely moving. Each bit of moving mass has some kinetic energy. The virtual mass is the mass that, if it were moving at the same speed as the arrow, would have the same total kinetic energy as the string and limbs. It’s a number determined by the limbs and string (and the riser too if it’s not very stiff) and it’s in the ballpark of about 100 grains for a recurve bow.
The default units for the above are Newtons for the force, kg for the masses, and meters for the lengths. But if you want to instead use pounds for draw weight, inches for draw lengths, grains for masses, and get a result in feet/second, you should use those units and multiply the final number by 137.
Looking at this equation, arrow speed should:
increase with the square root of the draw weight
decrease approximately with the square root of the brace height
decrease approximately with the square root of the arrow mass
So this means that if we want to see how arrow tune, and arrow tune alone affects the arrow speed, then the draw weight, brace height, and arrow mass must be kept constant. Otherwise, we can’t say whether an observed change in speed is caused by the arrow being in or out of tune or one of the above factors. So, to test this we’d need arrows that are too stiff, just right, and too weak that all weight the same.
Controlling variables
In order to make sure that any change in speed comes from the arrow tune only, we need to eliminate all other differences between the arrows.
Nock fit has a small effect on speed. So all arrows tested must use the same nocks.
Draw length has a large effect on speed. If the different arrows used don’t have the exact same length, then the clicker will need to be reliably adjusted to accommodate this. Using the above equation, accidentally having the clicker 1mm too far out or in changes the speed by 0.07 m/s (0.2 fps). To minimise this error, lines for clicker placement were marked at the correct distance for each arrow. The estimated accuracy of clicker placement is about 0.5 mm.
The speed is measured using a chronograph. In this case, it’s a magnetic chronograph with two coils 54 cm apart. The speed is calculated from that distance and the time between the magnetised arrow tip passing through each electrical coil, which induces a current in that coil. The precision of measuring the time between the two spikes is 0.01 ms, and a measurement that’s inacurate by that amount would change the speed by 0.08 m/s. The distance between the coils is constant, so any error will affect all speeds equally. If the distance was off by 5 mm, then all the speeds would be off by about 0.6 m/s.
Arrow mass needs to be the same. In practice, this means to within 0.2 grains (15.432 grains = 1 gram). If an arrow is 0.2 grains heavy then the expected difference in speed is 0.01 m/s
The bow and archer need to be the same. The string has already been broken in and there is no change in brace height during the session. As the archer’s form could change over the course of an end and over the session, the different spines of arrow should be shot at the same end, and with the order or the arrows varying between ends. I’ve previously found that if I’m not at anchor and release when the clicker goes, the speed can be reduced by 2 m/s despite the draw length being ostensibly the same. For “normal” shots, the standard deviation is about 0.3 m/s, meaning that 2/3 of my shots fall within a range of 0.6 m/s
Experimental setup
All arrows were shot by me using the same bow indoors. The bow was a modern recurve bow with a sight, clicker, pressure button, arrow rest, and stabilisers. The draw weight was measured as 40.6 lbs. The chronograph was placed just beyond the reach of the stabiliser, about 1.5 m in front of the archer. The target was at the same height as the bow. Other than adjustment of the clicker to account for the different arrow lengths, no changes were made between arrows or shooting sessions.
Arrow properties
The total mass of each arrow was 302.6 grains. This weight was chosen because I happened to have arrows of about that weight that were too stiff, too weak, and “in tune”. For arrows that were a grain or so under, copper tape was used at the nock end to make it match. This did not have a significant effect on the balance. Two arrows were used for each condition. Bareshafts were used to prevent clearance issues associated with large vanes and untuned arrows. As the lengths varied, lines were drawn on the riser so that the clicker could be adjusted reliably to within 0.5 mm to give the same draw weight for each arrow.
Arrow
Spine
length
vibration frequency
tune
in thou
cm, nock groove to tip
Hz
ACC
750
71.0
71, 74
very weak
ACE
620*
70.5
87
about right
ACE
520
71.9
88
stiff
ACE
470
72.2
92
very stiff
About 15mm had been removed from the back of these arrows, which stiffened the spine by several pounds.
These are all arrows that I already had lying around.
ACC 750: at least a few years old when my coach gave them to me about a decade ago. I shot them for about a year, and they’ve been lent out to other people a fair bit. They’re a bit scratched up but fly perfectly fine.
ACE 620: bought new around 2011 and in constant rotation since. The labels are still just about visible. They still land in the same place as much newer shafts. About a year ago, I cut about 15 mm from the back (not recommended by Easton). Cutting length of the back is supposed to give a larger stiffening effect than cutting the same distance from the front as it moves the wider middle part of an ACE shaft farther back. This was so that I could use heavier 110 gr points and still have them bareshaft tune as part of a different experiment.
ACE 520: old shafts given by my coach about a decade ago to play around with making bowstands. The labels are mostly worn off so they probably had quite heavy use before they were retired. They’re “Series G” instead of “Series H” which all the other shafts are, so it’s possible there’s something slightly different about the grade of carbon fibre or type of resin used or the way they were made as changes to the series number indicate some (probably very) slight change to manufacture. The surface feels a bit smoother and more polished than the other shafts over the entire length. They look very slightly darker than the other ACEs.
ACE 470: impulse bought as “for parts only” on eBay for £37 for a dozen shipped. It turned out they were only lightly used and a few looked unshot.
Each arrow was shot at least 10 times, to give at least 20 shots per spine. Within an end, they were generally shot from longest to shortest or vice versa.
Speed measurement
The speeds were measured using a copper coil induction chronograph with a sample rate of 88200 Hz and a distance between the coils of 0.53 m. When a magnetic item like an arrow point that has been swiped against a magnet passes through a wire coil, it induces an electric current in that coil. This is interpreted as “sound” if the cable is plugged into the microphone jack of a computer and the time between the two spikes can be measured. The sample rate used gave a maximum precision of 7 cm/s. As the chronograph was fairly robust, the distance between the coils was constant to within 1 mm, which gave an uncertainty of 11 cm/s.
The other likely source of variation in speed is the release of the archer. The speed of an arrow released when at full draw but improperly anchored due to inconsistent form is generally up to 2 m/s less than usual. The natural variation for “normal” shots varies day to day due to archer inconsistency but is in a range of 0.2-0.5 m/s.
Results and Discussion
Visible flight
To start, here’s what the arrows looked like at a few distances. The dark blue ACEs are my regular arrows and the bareshafts fly pretty straight and have the same horizontal position as the fletched arrows. They were included as a reference but weren’t part of the test as they weigh about 263 grains and I wouldn’t be able to add enough extra weight without it having a large effect on the spine.
The orange and green arrows are stiffer spined ACEs. The magenta ones are much weaker ACCs. When the light is right, I can see them curving in flight indoors. Outdoors, the 520 and 470 are about a foot or so stiff at 30m, and the ACC 750s are about a foot weak, relative to fletched and bare tuned arrows. This isn’t meant to be terribly precise – it’s just to give a ballpark indication that the stiff and weak arrows are definitely that, and that the ones I think are tuned are. While the short distances mean that the arrows would still be vibrating significantly in the horizontal plane when they hit the target, the amplitude of that vibration is only a few cm at most and is far outweighed by the angle of the arrow relative to the direction of flight.
Archer position was a bit off to one side at 8m – the dark blue arrows were approximately parallel to the line of flight at all distances.
Arrow speeds
The measured speed was not affected by whether or not the arrow was tuned, at least to the extent that’s visible with a sensitive chronograph.
Spine
Speed
Standard deviation
shots
m/s
m/s
470
60.64
.30
25
520
60.82
.30
28
620
60.67
.29
21
750
60.67
.25
20
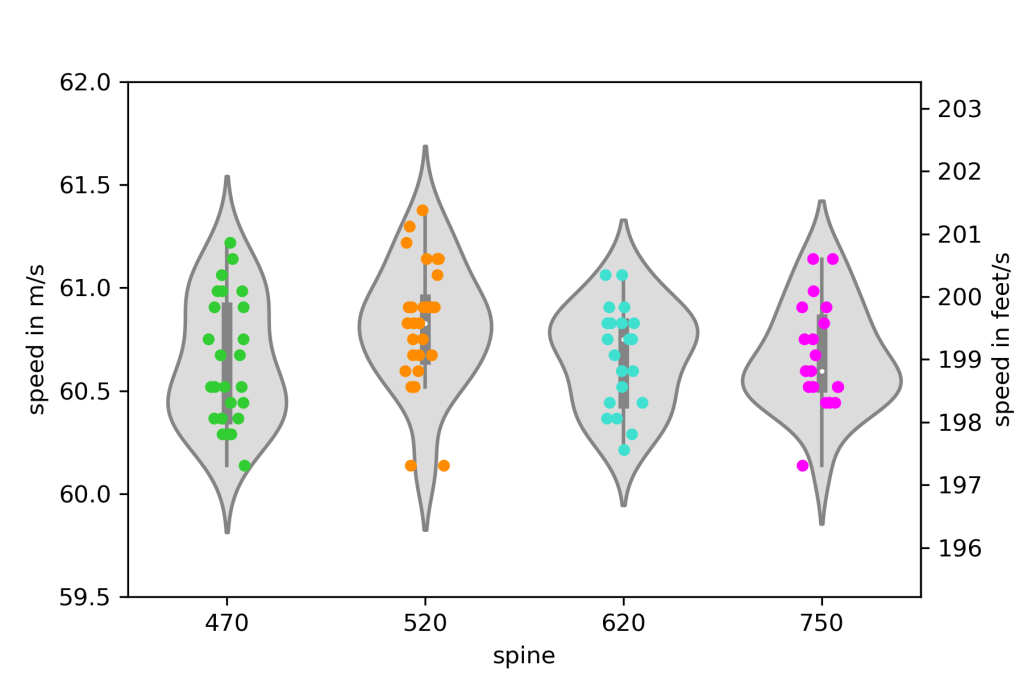
Table of average arrow speeds measured for each spine.
Violin plot showing the distribution of speeds for each spine of arrow shot. The scatter of points in the x direction is to make them more visible and does not indicate any change in spine.
Except for the 520 spine, none of these sets of data show a result that’s incompatible with the difference in speeds just being caused by random chance. If we use Student’s t-test, which is a statistical tool used to determine whether it is likely that two sets of data have the same average, to compare the speeds found for each arrow spine, we find that the difference is more likely attributed to random chance than to a difference in the actual average speed.
What about the 520 spine? Using that same test gives 90-96% confidence that there is a real difference between the average speed for that spine relative to the others, in other words that it wasn’t just random chance that caused the average speed to be a bit higher than the other arrows. As I shot multiple spines in each end, and alternated the order to cancel out any effect from my form changing during or between ends, I’m pretty confident that the difference isn’t caused by the way I shot them. The difference in speed between the 520 spine and the others isn’t big – about 16 cm/s, or 0.5 fps. The only odd thing about the 520s is that the surface looked a bit smoother and darker than the other arrows. With the labels hidden, both I and another person could pick out the 520s among the other arrows from their appearance so it’s not just my imagination.
It’s possible that there was just enough less friction against the arrow rest and pressure button to be noticeable. At some point in the future, I could repeat the test but using a significantly different draw weight. Then I could see whether the 520s being ever so slightly faster was because of some odd property of arrows that are two spines too stiff, or if it’s something specific to how those particular shafts were made.
So, what does this mean?
It definitely means that I can continue to calculate arrow speed based on the arrow mass and draw force curve without having to account for whether or not the system is tuned. For me with my bow and my arrows, there is currently no measureable effect on the speed caused by shooting a tuned or weak or stiff arrow. I do not expect that if I shot a different olympic-style recurve bow that any effect would appear, nor would I expect a different person shooting my bow to see an effect.
It does not mean that it is impossible for arrow spine to influence arrow speed for anyone else. However, I think it would be very unlikely, at least for olympic-style recurve bows as there isn’t a mechanism that I know of that would be responsible for this effect. If anyone has any data or simulation that shows a different effect, I would be glad to see it and try to reproduce it myself.
What about other situations?
Without testing a wide range of bows and arrows that I don’t own, or using a release hand that’s not mine, it’s impossible to be 100% confident about whether these results would be different in another situation. The closer the situation is to a human using an olympic-style recurve bow and modern arrows that are within several spines of the “correct” one, the more confident I am that this result would be repeated.
What about the stiffest and weakest spines?
If the weak arrows are so weak that they’re in danger of breaking, then some of the bow’s energy might go into irreversibly bending or cracking the arrow instead of pushing it towards the target. If the arrow is infinitely stiff, then it won’t bend at all when released and instead it’ll rotate and push much more into the pressure button as it slides past, which maybe could give a measurable frictional loss. However, those situations are unrealistically far away from the sort of scenarios that might be encountered when shooting.
Traditional bows
A tuned arrow should clear the sight window without hitting anything. A stiff or weak arrow, depending on how untuned it is and whether the sight window is cut close to the center of the bow, may hit or slide against part of the bow some or all of the time, which would cause some friction and maybe reduce the speed by a measurable amount. With a longbow or many traditional bows where the arrow position couldn’t be adjusted to be straight down the center of the bow, then a significant amount of unavoidable contact would be likely when far too stiff or far too weak spines were tested. I do not see how the energy imparted to the arrow by the bow could be separated from the energy removed by it rubbing against the bow.
In order to measure the effect over the (smaller) range of spines were arrow clearance was ok, the draw length would need to be consistent to within a mm, the bow would need to be the same draw weight for the whole test (which can be an issue with non-laminated wooden bows). To get the speed consistent to within 0.3 m/s, the draw weight would need to not vary by more than 0.4 lbs when held at full draw, and the draw length would need to be consistent to within 2 mm. So it would be more effort to gather the same data, but possible. A laminated bow with some sort of clicker attached could work.
Nock friction
A tuned arrow is generally accepted to leave the string at a specific stage in its bending cycle. Looking at high speed videos of top international archers at competitions (so hopefully they though their arrows were tuned) like this or this or this (at 6:25 and 6:30), when the arrow leaves the string the point is pointing toward the bow side but is a few milliseconds away from being straight. A stiffer arrow bends back and forth more quickly, so will have be closer to straight when it leaves the string, and a weaker arrow bends more slowly so will be more bent when it leaves. So unless the arrow leaves the string when it’s at its maximum bend in either direction, there will be some amount of sideways force on the nock as it detaches from the string. I included the bending frequencies of the arrows I tested in the table with the information about each arrow. There’s quite a wide range: in the time for the weakest arrow to vibrate by one cycle, the stiffest one has vibrated 1.27 cycles. The speed at which the arrow bends in free flight may be a bit different to when it’s still attached to the string, but that difference should be the same for all arrows shot from the same bow. So we can be pretty confident that the bend of these arrows would have looked different at the moment they left the string and therefore that the nocks would have been at different angles when it left the string. However, that bit of friction between the nock groove and string wasn’t enough to change the speed. If nocks were made out of a material with much more friction against the center serving (like coarse sandpaper or a sticky rubber) instead of smooth plastic, then it’s possible that this effect would cause a noticeable difference in the speeds.
Drag
An untuned arrow that leaves the bow oscillating initially in a direction that’s different to the movement of its center of mass should experience more somewhat drag than one flying (on average) in a straight line towards the target. If a chronograph was set up in front of a target 70 m away instead of just in front of the archer, there might be a noticeable speed difference between arrows of the same weight but a different spine.
However, the arrow diameter and length also affect the drag considerably. If an arrow like an ACE loses about 10% of its speed on the way to a 70m target, then an ACC with a 10% larger diameter and 21% larger frontal area might lose closer to 20% – definitely a significant difference. So the arrows used to test this would need to have the same weight, length, and diameter which means only the internal diameter and material would be able to vary. In practice, that severely limits the possibilities for such a test.
A graph with some possible regions is shown below. Black boxes indicate areas where 3 or more different spines of arrow with a 28″ shaft and recommended point weight have similar diameter end weight but different spines. Between cutting the shafts to account for different point lengths, and careful choice of the nock system for each, sets of arrows matched to within a grain and with diameters within 0.015″ (0.38 mm) could be tested at long distances. The widest range of suitable spines is found at 250 grains, where arrows with spines from 1400 to 670 could be compared if suitable draw weight at which the 1400 shafts were weak but not in danger of breaking was used. To mitigate the possible effect of different friction forces between different arrow materials against the arrow rest and button, tape could be applied to the contact regions.
Graph of arrow weight against external diameter. The point weights used were the average recommended value. Where none could be found, the average value for similar shafts were used. In In the case of the ACE which is wider at the center, the diameter is the maximum diameter. The diameter at the ends is closer to about 0.205″. The spine numbers of the arrows in the black boxes are adjacent to them.
I don’t have a suitable set of arrows for this test, though I may revisit it in the future.
Overall conclusions
Tuned arrows didn’t fly any faster than stiff or weak arrows
I don’t need to add a “tuning constant” into the equation that I use to estimate arrow speeds.
There’s something a bit odd about my 520 spine arrows which are much smoother than the others.


 is the arrow speed,
 is the draw weight,
 is the distance the arrow moves when being drawn back, so
  is a unitless number that indicates how much extra energy is stored during the draw relative to a bow where the increase in draw force varies linearly across the whole range. It is constant for a given draw force curve – which means that if the draw weight is adjusted by changing the angle of the limbs, the constant will change also. It’s a number between 1 and maybe 1.5 for a recurve bow (1.16 for my bow with Samick Extreme limbs which have a “conventional” geometry and are made from carbon fibre+foam). If the integral of the draw weight over the draw length was used instead of just force x displacement, then the constant wouldn’t be needed.
 mass is for the whole arrow,
 is the virtual mass. There’s more detail about it